From Jan–June 2025, top stocks were Trans-Century, Liberty Kenya, and Home Afrika. Investment, Telecom, and Insurance led in performance. REITs, Agriculture, and Automobiles lagged. Volatile sectors offer high risk/reward; stable ones suit cautious investors.
Monthly stock market analysis helps identify sectoral strengths and vulnerabilities, revealing periods of growth or decline and underlying economic factors. By analyzing average monthly changes in stock prices from January to June, investors can understand stability and disruption patterns in the first half of the year.
Top 10 stocks like Trans-Century (+106.5%), Liberty Kenya (+77.6%), and Home Afrika (+72.2%) showed strong growth in investment, energy, and insurance sectors. Bottom 10 stocks, including Kenya Airways (-32.1%) and Kenya Orchards (-19.5%), struggled due to sectoral or operational challenges.
Tip: Invest in top performers for growth, but assess volatility. Diversify with stable sectors (e.g., insurance, banking) to hedge risks from underperforming or shock-prone stocks.
The analysis below highlights the stocks that experience the most industrial shocks (highest volatility) and those that demonstrate the most consistency (lowest volatility) based on changes observed over the measured period.
Stocks with Most Industrial Shocks (Highest Volatility)
These companies experienced the largest fluctuations in their monthly changes, indicating they were most affected by shocks or instability:
Mumias Sugar Co. Ltd (std dev: 45.12, mean change: 21.66)
East African Breweries Plc (std dev: 33.98, mean change: 15.16)
Kenya Power & Lighting Plc 7% Pref (std dev: 32.34, mean change: 12.84)
Crown Paints Kenya Plc (std dev: 23.36, mean change: 11.77)
Nairobi Securities Exchange Plc (std dev: 19.08, mean change: 13.80)
CIC Insurance Group Ltd (std dev: 18.73, mean change: 11.33)
TotalEnergies Marketing Kenya Plc (std dev: 17.67, mean change: 9.44)
Carbacid Investments Plc (std dev: 16.94, mean change: 4.00)
WPP Scangroup Plc (std dev: 16.09, mean change: 11.16)
Britam Holdings Plc (std dev: 14.69, mean change: 9.46)
Stocks with Most Consistency (Lowest Volatility)
These companies showed the least variation in their monthly changes, indicating stability or resilience to industrial shocks:
Nation Media Group Plc (std dev: 0.0, mean change: 0.0)
KenGen Co. Plc (std dev: 0.0, mean change: 0.0)
Kenya Airways Ltd (std dev: 0.0, mean change: 0.0)
Umeme Ltd (std dev: 0.0, mean change: 0.0)
Falme Tree Group Holdings Ltd (std dev: 0.0, mean change: 0.0)
Jubilee Holdings Ltd (std dev: 1.02, mean change: 0.50)
Kenya Re Insurance Corporation Ltd (std dev: 1.36, mean change: 0.67)
Car& General(K) Ltd (std dev: 1.69, mean change: -0.90)
Kenya Power & Lighting Co. Plc (std dev: 1.72, mean change: -0.66)
The Co-operative Bank of Kenya Ltd (std dev: 2.45, mean change: 3.70)
Interpretation:
Companies with high standard deviation experienced the most dramatic swings, suggesting exposure to sectoral shocks, market events, or operational instability.
Companies with low standard deviation maintained steady performance, reflecting operational consistency or insulation from broader industry volatility.
B. Sector-Wise Analysis
Top 3 Most Performing Sectors (by average cumulative change): This reveals which sectors outperformed or underperformed from January to June
Sector
Average Cumulative Change (%)
Investment
45.98
Telecommunication
33.71
Insurance
32.99
Top 3 Under-Performing Sectors (by average cumulative change):
Sector
Average Cumulative Change (%)
Real Estate Investment Trust
0
Agricultural
-1.79
Automobiles
-8.85
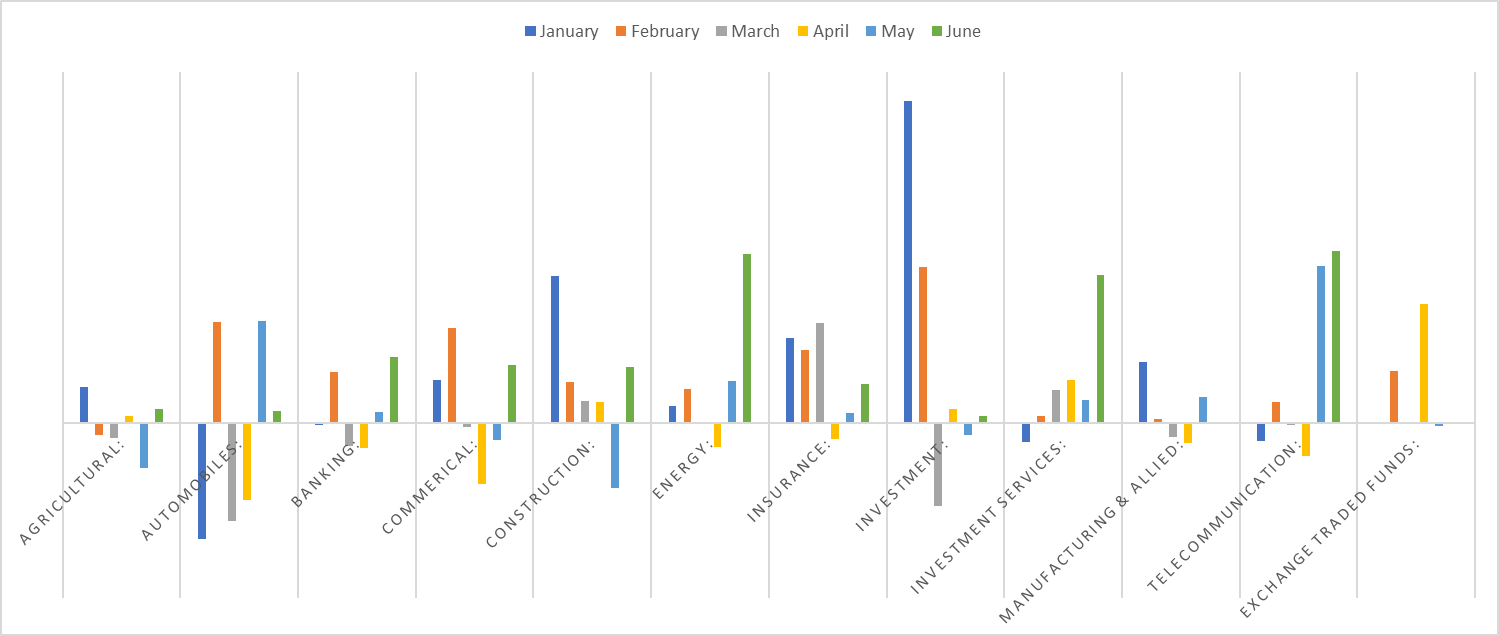
Sector-Wise Monthly Averages: This method identifies sectoral momentum or industry-specific shocks. It allows for the comparison and calculation of the average monthly return for all companies within a specific sector, which can then be compared to other sectors for the same month.
Analysis:
Sector
Most Shocks?
Most Consistent?
Notable Months
Automobiles
Yes
No
Jan, Feb, Mar, Apr, May
Investment
Yes
No
Jan, Feb, Mar
Telecommunication
Yes
No
May, Jun
Energy
Yes
No
Jun
Construction
Yes
No
Jan, May
Commercial
Moderate
No
Feb, Apr
Manufacturing & Allied
No
Yes
All months
Insurance
No
Yes
All months
Banking
No
Yes
All months
Investment Services
Moderate
Moderate
Jun
Real Estate Inv. Trust
No
Yes
All months (0% change)
Exchange Traded Funds
No
Yes (low activity)
Feb, Apr
Most volatile/shock-prone sectors: Automobiles, Investment, Telecommunication, Energy, Construction.
Most consistent/stable sectors: Real Estate Investment Trust, Manufacturing & Allied, Insurance, Banking.
Tip: For investors seeking stability, focus on consistent sectors. For those seeking high risk/reward, watch the shock-prone sectors, but be mindful of the volatility.
Recommendation
Diversify Across Sectors: Balance high-growth sectors like Investment and Telecommunication with stable sectors such as Insurance and Banking to manage risk.
Capitalize on Momentum: Consider short- to mid-term investments in top-performing stocks like Trans-Century, Liberty Kenya, and Home Afrika, which showed strong upward trends.
Avoid Persistently Underperforming Stocks: Steer clear of consistently struggling companies such as Kenya Airways and Kenya Orchards unless restructuring or turnaround signs appear.
Monitor Volatile Sectors Closely: Investment, Automobiles, and Energy sectors showed high volatility. Trade with caution or use stop-loss strategies to manage risk.
Stability for Long-Term Investors: For steady returns, focus on consistent performers and low-volatility sectors like Insurance, REITs, and Manufacturing & Allied.
Watch Emerging Trends: Track sectors with recent momentum, such as Telecommunication and Construction, which showed gains in specific months.
Use Volatility as an Entry Point: Stocks with high standard deviation may present trading opportunities—but only for experienced, risk-tolerant investors.
Editors’ Remarks:
It is more prudent to invest in Home Afrika than in Trans-Century, despite the latter recording the highest gains. This is because Equity Group is seeking to seize Trans-Century, the parent company of East African Cables, due to its debt challenges. Liberty Insurance also demonstrates strong growth prospects, while Safaricom, in the telecommunications sector, remains a solid investment choice. For diversification within the banking sector, I&M Bank and NCBA are ideal for risk-averse investors, given the sector’s low volatility and their stable performance.
Kenya’s new VASP Act and IRA regulations formalize digital-asset oversight, enabling tailored insurance for risks like hacking, fraud and key loss. Global insurers now offer crime, custody, cyber and D&O coverage as adoption grows. Strong governance and secure custody remain essential for safe digital-asset use.
Parliament has removed the 33% ownership cap on capital markets firms, shifting authority to set shareholding limits to the Cabinet Secretary with CMA input. The reform aims to attract larger investors, support consolidation and modernize the sector, while core licensing and governance rules under Section 29(1) remain intact.
Why Payment Finance (PayFi) represents Kenya's optimal route to becoming Africa's premier blockchain innovation hub, leveraging regulatory alignment, infrastructure readiness, and quantifiable economic impact. This brief demonstrates how PayFi's compliance-first architecture positions Kenya to capture massive value in cross-border payments, merchant settlement, and SME financing while mitigating t